
Page 70 - 2023 AV EDGE RTR
P. 70
D
Keene
tehachapi
city St ats tehachapi e
city Stats
Sand
Bear Canyon
Valley
Springs Golden Tehachapi m
Hills
o
Cummings
Valley
Stallion Tehachapi: City of Tehachapi, 115 S. Robinson St., Tehachapi, CA 93561 (661) 822-2200
Springs
Alpine g
Forest LiveUpTehachapi.com
r
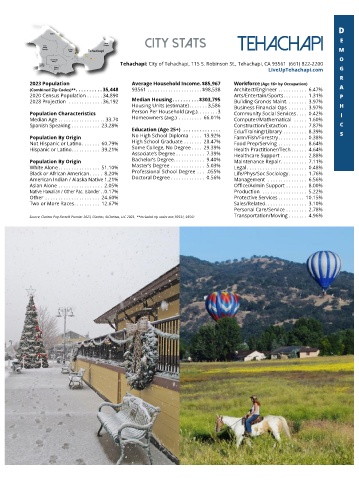
2023 Population Average Household Income . $85,967 Workforce (Age 16+ by Occupation)
(Combined Zip Codes)** . . . . . . . . . . 35,448 93561 . . . . . . . . . . . . . . . . . . . . . $98,538 Architect/Engineer . . . . . . . . . . . 6.47% a
2020 Census Population . . . . . . 34,890 Arts/Entertain/Sports . . . . . . . . . 1.31% P
2028 Projection . . . . . . . . . . . . . 36,192 Median Housing . . . . . . . . . .$303,795 Building Gronds Maint. . . . . . . . 3.97%
Housing Units (estimate) . . . . . . . 3,586 Business Financial Ops . . . . . . . 3.97% h
Population Characteristics Person Per Household (avg.). . . . . . . .3 Community Social Services . . . . 0.42% i
Median Age . . . . . . . . . . . . . . . . . . 33.70 Homeowners (avg.) . . . . . . . . . 66.01% Computer/Mathematical . . . . . 1.60%
Spanish Speaking . . . . . . . . . . . 23.28% Construction/Extaction . . . . . . . 7.87% c
Education (Age 25+) . . . . . . . . . . . . . . Edu/Training/Library . . . . . . . . . 8.39%
Population By Origin No High School Diploma . . . . 13.92% Farm/Fish/Forestry . . . . . . . . . . . 0.38% s
Not Hispanic or Latino . . . . . . . 60.79% High School Graduate . . . . . . . 28.47% Food Prep/Serving . . . . . . . . . . . 8.64%
Hispanic or Latino . . . . . . . . . . . 39.21% Some College, No Degree . . . . 29.39% Health Practitioner/Tech . . . . . . 4.64%
Associate’s Degree . . . . . . . . . . . 7.39% Healthcare Support . . . . . . . . . . 2.88%
Population By Origin Bachelor’s Degree . . . . . . . . . . . . 9.40% Maintenance Repair . . . . . . . . . . 7.11%
White Alone . . . . . . . . . . . . . . . . 51.10% Master’s Degree . . . . . . . . . . . . . 5.03% Legal . . . . . . . . . . . . . . . . . . . . . . . 0.48%
Black or African American . . . . . 8.20% Professional School Degree . . . .055% Life/Phys/Soc Sociology . . . . . . . 1.76%
American Indian / Alaska Native 1.21% Doctoral Degree . . . . . . . . . . . . . 0.56% Management . . . . . . . . . . . . . . . 6.56%
Asian Alone . . . . . . . . . . . . . . . . . 2.05% Office/Admin Support . . . . . . . . 8.00%
Native Hawaiian / Other Pac. Islander . .0.17% Production . . . . . . . . . . . . . . . . . 5.22%
Other . . . . . . . . . . . . . . . . . . . . . 24.60% Protective Services . . . . . . . . . . 10.15%
Two or More Races . . . . . . . . . . 12.67% Sales/Related . . . . . . . . . . . . . . . . 3.10%
Personal Care/Service . . . . . . . . 2.78%
Source: Claritas Pop-Facts® Premier 2023, Claritas, ©Claritas, LLC 2023. **Included zip codes are: 93531, 93561 Transportation/Moving . . . . . . . 4.96%
AVEDGECA.ORG | 2023 Economic Report | 9 |