
Page 69 - 2023 AV EDGE RTR
P. 69
D
Ridgecrest
395
e Ridgecrest City St ats Ridgecrest
City Stats
m 178
o
g City of Ridgecrest: 100 W. California Ave., Ridgecrest, CA 93555, (760) 499-5000
Ridgecrest-CA.gov
r
a
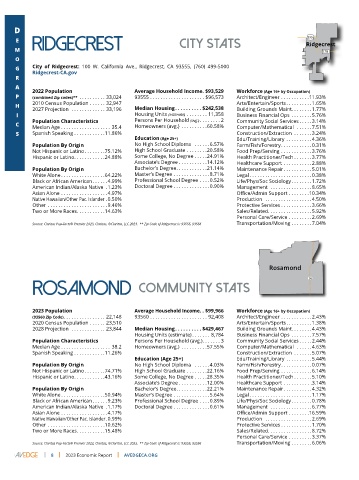
2022 Population Average Household Income . $93,529 Workforce (Age 16+ by Occupation)
P (combined Zip codes)** . . . . . . . . . . 33,024 93555 . . . . . . . . . . . . . . . . . . . . . $96,573 Architect/Engineer . . . . . . . . . . .11.93%
h 2010 Census Population . . . . . . 32,947 Median Housing . . . . . . . . . . $242,538 Arts/Entertain/Sports . . . . . . . . . .1.65%
Building Grounds Maint. . . . . . . .1.77%
2027 Projection . . . . . . . . . . . . . 33,196
i Housing Units (estimate) . . . . . . . . 11,358 Business Financial Ops . . . . . . . .5.76%
Population Characteristics Persons Per Household (avg.) . . . . . . . . 2 Community Social Services . . . . .3.14%
c Median Age . . . . . . . . . . . . . . . . . . . 35.4 Homeowners (avg.) . . . . . . . . . .60.58% Computer/Mathematical . . . . . .7.51%
s Spanish Speaking . . . . . . . . . . . .11.86% Construction/Extraction . . . . . . .3.24%
Education (Age 25+) Edu/Training/Library . . . . . . . . . .4.36%
Population By Origin No High School Diploma . . . . . .6.57% Farm/Fish/Forestry . . . . . . . . . . . .0.31%
Not Hispanic or Latino . . . . . . . .75.12% High School Graduate . . . . . . . .20.58% Food Prep/Serving . . . . . . . . . . . .3.76%
Hispanic or Latino . . . . . . . . . . . .24.88% Some College, No Degree . . . . .24.91% Health Practitioner/Tech . . . . . . .3.77%
Associate’s Degree . . . . . . . . . . .14.12% Healthcare Support . . . . . . . . . . .2.88%
Population By Origin Bachelor’s Degree . . . . . . . . . . . .21.14% Maintenance Repair . . . . . . . . . . .5.01%
White Alone . . . . . . . . . . . . . . . . .64.22% Master’s Degree . . . . . . . . . . . . . .8.71% Legal . . . . . . . . . . . . . . . . . . . . . . . .0.38%
Black or African American . . . . . .4.99% Professional School Degree . . . .0.52% Life/Phys/Soc Sociology . . . . . . . .1.72%
American Indian/Alaska Native .1.23% Doctoral Degree . . . . . . . . . . . . . .0.90% Management . . . . . . . . . . . . . . . .8.65%
Asian Alone . . . . . . . . . . . . . . . . . .4.97% Office/Admin Support . . . . . . . .10.34%
Native Hawaiian/Other Pac. Islander .0.50% Production . . . . . . . . . . . . . . . . . .4.50%
Other . . . . . . . . . . . . . . . . . . . . . . .9.46% Protective Services . . . . . . . . . . . .3.66%
Two or More Races . . . . . . . . . . .14.63% Sales/Related . . . . . . . . . . . . . . . . .5.92%
Personal Care/Service . . . . . . . . .2.69%
Source: Claritas Pop-Facts® Premier 2023, Claritas, ©Claritas, LLC 2023. ** Zip Code of Ridgecrest is: 93555, 93556 Transportation/Moving . . . . . . . .7.04%
Rosamond
rosamond community Stats
rosamond
nity
commu
ats
St
2023 Population Average Household Income . . $99,966 Workforce (Age 16+ by Occupation)
(93560 Zip Code) . . . . . . . . . . . . . . . . 22,148 93560 . . . . . . . . . . . . . . . . . . . . . . 92,408 Architect/Engineer . . . . . . . . . . . .2.43%
2020 Census Population . . . . . . 23,510 Arts/Entertain/Sports . . . . . . . . . .1.38%
2028 Projection . . . . . . . . . . . . . 23,844 Median Housing . . . . . . . . . . $429,467 Building Grounds Maint. . . . . . . .4.43%
Housing Units (estimate) . . . . . . . 8,784 Business Financial Ops . . . . . . . .7.57%
Population Characteristics Persons Per Household (avg.) . . . . . . . 3 Community Social Services . . . . .2.44%
Median Age . . . . . . . . . . . . . . . . . . . 38.2 Homeowners (avg.) . . . . . . . . . .57.55% Computer/Mathematical . . . . . .4.63%
Spanish Speaking . . . . . . . . . . . .11.26% Construction/Extraction . . . . . . .5.07%
Education (Age 25+) Edu/Training/Library . . . . . . . . . .5.44%
Population By Origin No High School Diploma . . . . . .4.03% Farm/Fish/Forestry . . . . . . . . . . . .0.07%
Not Hispanic or Latino . . . . . . . .74.71% High School Graduate . . . . . . . .22.16% Food Prep/Serving . . . . . . . . . . . .6.14%
Hispanic or Latino . . . . . . . . . . . .43.16% Some College, No Degree . . . . .28.35% Health Practitioner/Tech . . . . . . .5.10%
Associate’s Degree . . . . . . . . . . .12.00% Healthcare Support . . . . . . . . . . .3.14%
Population By Origin Bachelor’s Degree . . . . . . . . . . . .22.21% Maintenance Repair . . . . . . . . . . .4.32%
White Alone . . . . . . . . . . . . . . . . .50.94% Master’s Degree . . . . . . . . . . . . . .5.64% Legal . . . . . . . . . . . . . . . . . . . . . . . .1.17%
Black or African American . . . . . .9.23% Professional School Degree . . . .0.89% Life/Phys/Soc Sociology . . . . . . . .0.78%
American Indian/Alaska Native .1.17% Doctoral Degree . . . . . . . . . . . . . .0.61% Management . . . . . . . . . . . . . . . .6.77%
Asian Alone . . . . . . . . . . . . . . . . . .4.17% Office/Admin Support . . . . . . . .16.59%
Native Hawaiian/Other Pac. Islander .0.99% Production . . . . . . . . . . . . . . . . . .2.69%
Other . . . . . . . . . . . . . . . . . . . . . .10.62% Protective Services . . . . . . . . . . . .1.70%
Two or More Races . . . . . . . . . . .15.48% Sales/Related . . . . . . . . . . . . . . . . .8.72%
Personal Care/Service . . . . . . . . .3.37%
Source: Claritas Pop-Facts® Premier 2023, Claritas, ©Claritas, LLC 2023. ** Zip Code of Ridgecrest is: 93555, 93556 Transportation/Moving . . . . . . . .6.06%
| 8 | 2023 Economic Report | AVEDGECA.ORG