
Page 68 - 2023 AV EDGE RTR
P. 68
D
California city
City St ats California city e
City Stats
California m
City o
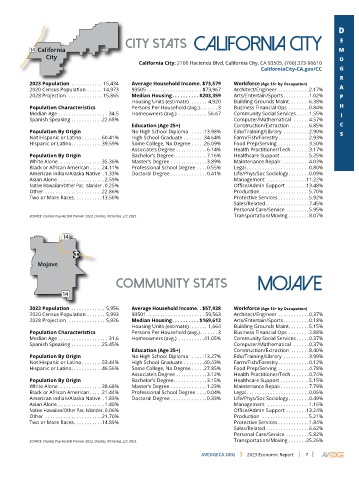
California City: 2100 Hacienda Blvd, California City, CA 93505, (760) 373-96610
CaliforniaCity-CA.gov/CC g
r
2023 Population . . . . . . . . . . . . 15,434 Average Household Income . $73,579 Workforce (Age 16+ by Occupation)
2020 Census Population . . . . . . 14,973 93505 . . . . . . . . . . . . . . . . . . . . . $73,967 Architect/Engineer . . . . . . . . . . . .2.17% a
2028 Projection . . . . . . . . . . . . . 15,865 Median Housing . . . . . . . . . . $203,359 Arts/Entertain/Sports . . . . . . . . . .1.02% P
Housing Units (estimate) . . . . . . . 4,920 Building Grounds Maint. . . . . . . .6.38%
Population Characteristics Persons Per Household (avg.) . . . . . . . 3 Business Financial Ops . . . . . . . .0.84% h
Median Age . . . . . . . . . . . . . . . . . . . 34.5 Homeowners (avg.) . . . . . . . . . . . 56.67 Community Social Services . . . . .1.55% i
Spanish Speaking . . . . . . . . . . . .22.68% Computer/Mathematical . . . . . .4.57%
Education (Age 25+) Construction/Extraction . . . . . . .6.85% c
Population By Origin No High School Diploma . . . . .13.98% Edu/Training/Library . . . . . . . . . .2.90% s
Not Hispanic or Latino . . . . . . . .60.41% High School Graduate . . . . . . . .34.64% Farm/Fish/Forestry . . . . . . . . . . . .2.93%
Hispanic or Latino . . . . . . . . . . . .39.59% Some College, No Degree . . . . .26.09% Food Prep/Serving . . . . . . . . . . . .3.50%
Associate’s Degree . . . . . . . . . . . .6.14% Health Practitioner/Tech . . . . . . .3.17%
Population By Origin Bachelor’s Degree . . . . . . . . . . . . .7.16% Healthcare Support . . . . . . . . . . .5.25%
White Alone . . . . . . . . . . . . . . . . .35.36% Master’s Degree . . . . . . . . . . . . . .3.89% Maintenance Repair . . . . . . . . . . .4.03%
Black or African American . . . . .24.11% Professional School Degree . . . .0.55% Legal . . . . . . . . . . . . . . . . . . . . . . . .0.80%
American Indian/Alaska Native .1.33% Doctoral Degree . . . . . . . . . . . . . .0.41% Life/Phys/Soc Sociology . . . . . . . .0.09%
Asian Alone . . . . . . . . . . . . . . . . . .2.59% Management . . . . . . . . . . . . . . .11.22%
Native Hawaiian/Other Pac. Islander .0.25% Office/Admin Support . . . . . . . .13.48%
Other . . . . . . . . . . . . . . . . . . . . . .22.86% Production . . . . . . . . . . . . . . . . . .5.70%
Two or More Races . . . . . . . . . . .13.50% Protective Services . . . . . . . . . . . .5.92%
Sales/Related . . . . . . . . . . . . . . . . .7.45%
Personal Care/Service . . . . . . . . .5.95%
SOURCE: Claritas Pop-Facts® Premier 2023, Claritas, ©Claritas, LLC 2023. Transportation/Moving . . . . . . . .8.07%
Mojave
mo
ave
j
commu
community Stats mojave
ats
nity St
2023 Population . . . . . . . . . . . . . 5,956 Average Household Income . . $57,928 Workforce (Age 16+ by Occupation)
2020 Census Population . . . . . . . 5,993 93501 . . . . . . . . . . . . . . . . . . . . . . 59,563 Architect/Engineer . . . . . . . . . . . .0.37%
2028 Projection . . . . . . . . . . . . . . 5,926 Median Housing . . . . . . . . . . $169,612 Arts/Entertain/Sports . . . . . . . . . .0.18%
Housing Units (estimate) . . . . . . . 1,664 Building Grounds Maint. . . . . . . .5.15%
Population Characteristics Persons Per Household (avg.) . . . . . . . 3 Business Financial Ops . . . . . . . .2.88%
Median Age . . . . . . . . . . . . . . . . . . . 31.6 Homeowners (avg.) . . . . . . . . . .41.05% Community Social Services . . . . .0.37%
Spanish Speaking . . . . . . . . . . . .25.45% Computer/Mathematical . . . . . .0.37%
Education (Age 25+) Construction/Extraction . . . . . . .8.40%
Population By Origin No High School Diploma . . . . .13.27% Edu/Training/Library . . . . . . . . . .3.99%
Not Hispanic or Latino . . . . . . . .53.44% High School Graduate . . . . . . . .40.43% Farm/Fish/Forestry . . . . . . . . . . . .0.12%
Hispanic or Latino . . . . . . . . . . . .46.56% Some College, No Degree . . . . .27.85% Food Prep/Serving . . . . . . . . . . . .4.78%
Associate’s Degree . . . . . . . . . . . .3.12% Health Practitioner/Tech . . . . . . .0.74%
Population By Origin Bachelor’s Degree . . . . . . . . . . . . .3.15% Healthcare Support . . . . . . . . . . .5.15%
White Alone . . . . . . . . . . . . . . . . .38.68% Master’s Degree . . . . . . . . . . . . . .1.23% Maintenance Repair . . . . . . . . . . .7.79%
Black or African American . . . . .21.44% Professional School Degree . . . .0.04% Legal . . . . . . . . . . . . . . . . . . . . . . . .0.06%
American Indian/Alaska Native .1.83% Doctoral Degree . . . . . . . . . . . . . .0.33% Life/Phys/Soc Sociology . . . . . . . .0.49%
Asian Alone . . . . . . . . . . . . . . . . . .1.40% Management . . . . . . . . . . . . . . . .1.16%
Native Hawaiian/Other Pac. Islander .0.06% Office/Admin Support . . . . . . . .13.24%
Other . . . . . . . . . . . . . . . . . . . . . .21.70% Production . . . . . . . . . . . . . . . . . .5.21%
Two or More Races . . . . . . . . . . .14.89% Protective Services . . . . . . . . . . . .1.84%
Sales/Related . . . . . . . . . . . . . . . . .6.62%
Personal Care/Service . . . . . . . . .5.82%
SOURCE: Claritas Pop-Facts® Premier 2023, Claritas, ©Claritas, LLC 2023. Transportation/Moving . . . . . . .25.26%
AVEDGECA.ORG | 2023 Economic Report | 7 |